SEASONAL SCAN: ACTIVE
Send the crews to the patches, not across the whole unit.
A seasonal map of the invasive species you name, made from hyperspectral imagery captured when it stands out from the native cover.
What the season looks like without a map
Your crews go out when the target species is at its most visible, and the calendar gives you a short stretch to get round the management area before it sets seed. The record you start from is last year's treatment log plus whatever landowners and walkers have phoned in. That tells you where the plant was. It says little about where it has got to.
So the units get walked. A crew walks a whole parcel, finds one patch of the species near a track, sprays it and moves on. The next unit is thick with patches and needs a second visit. You cannot tell which parcel is which until a crew has stood in it, and the remote corners of the area, up the watercourse or behind the fence line, are the ones that slip to next year. A patch missed this season is a bigger patch, with seed in the ground, by the next.
Then the season is over and you write the programme report from treatment records that show where the crews went, which is not the same as where the species is.
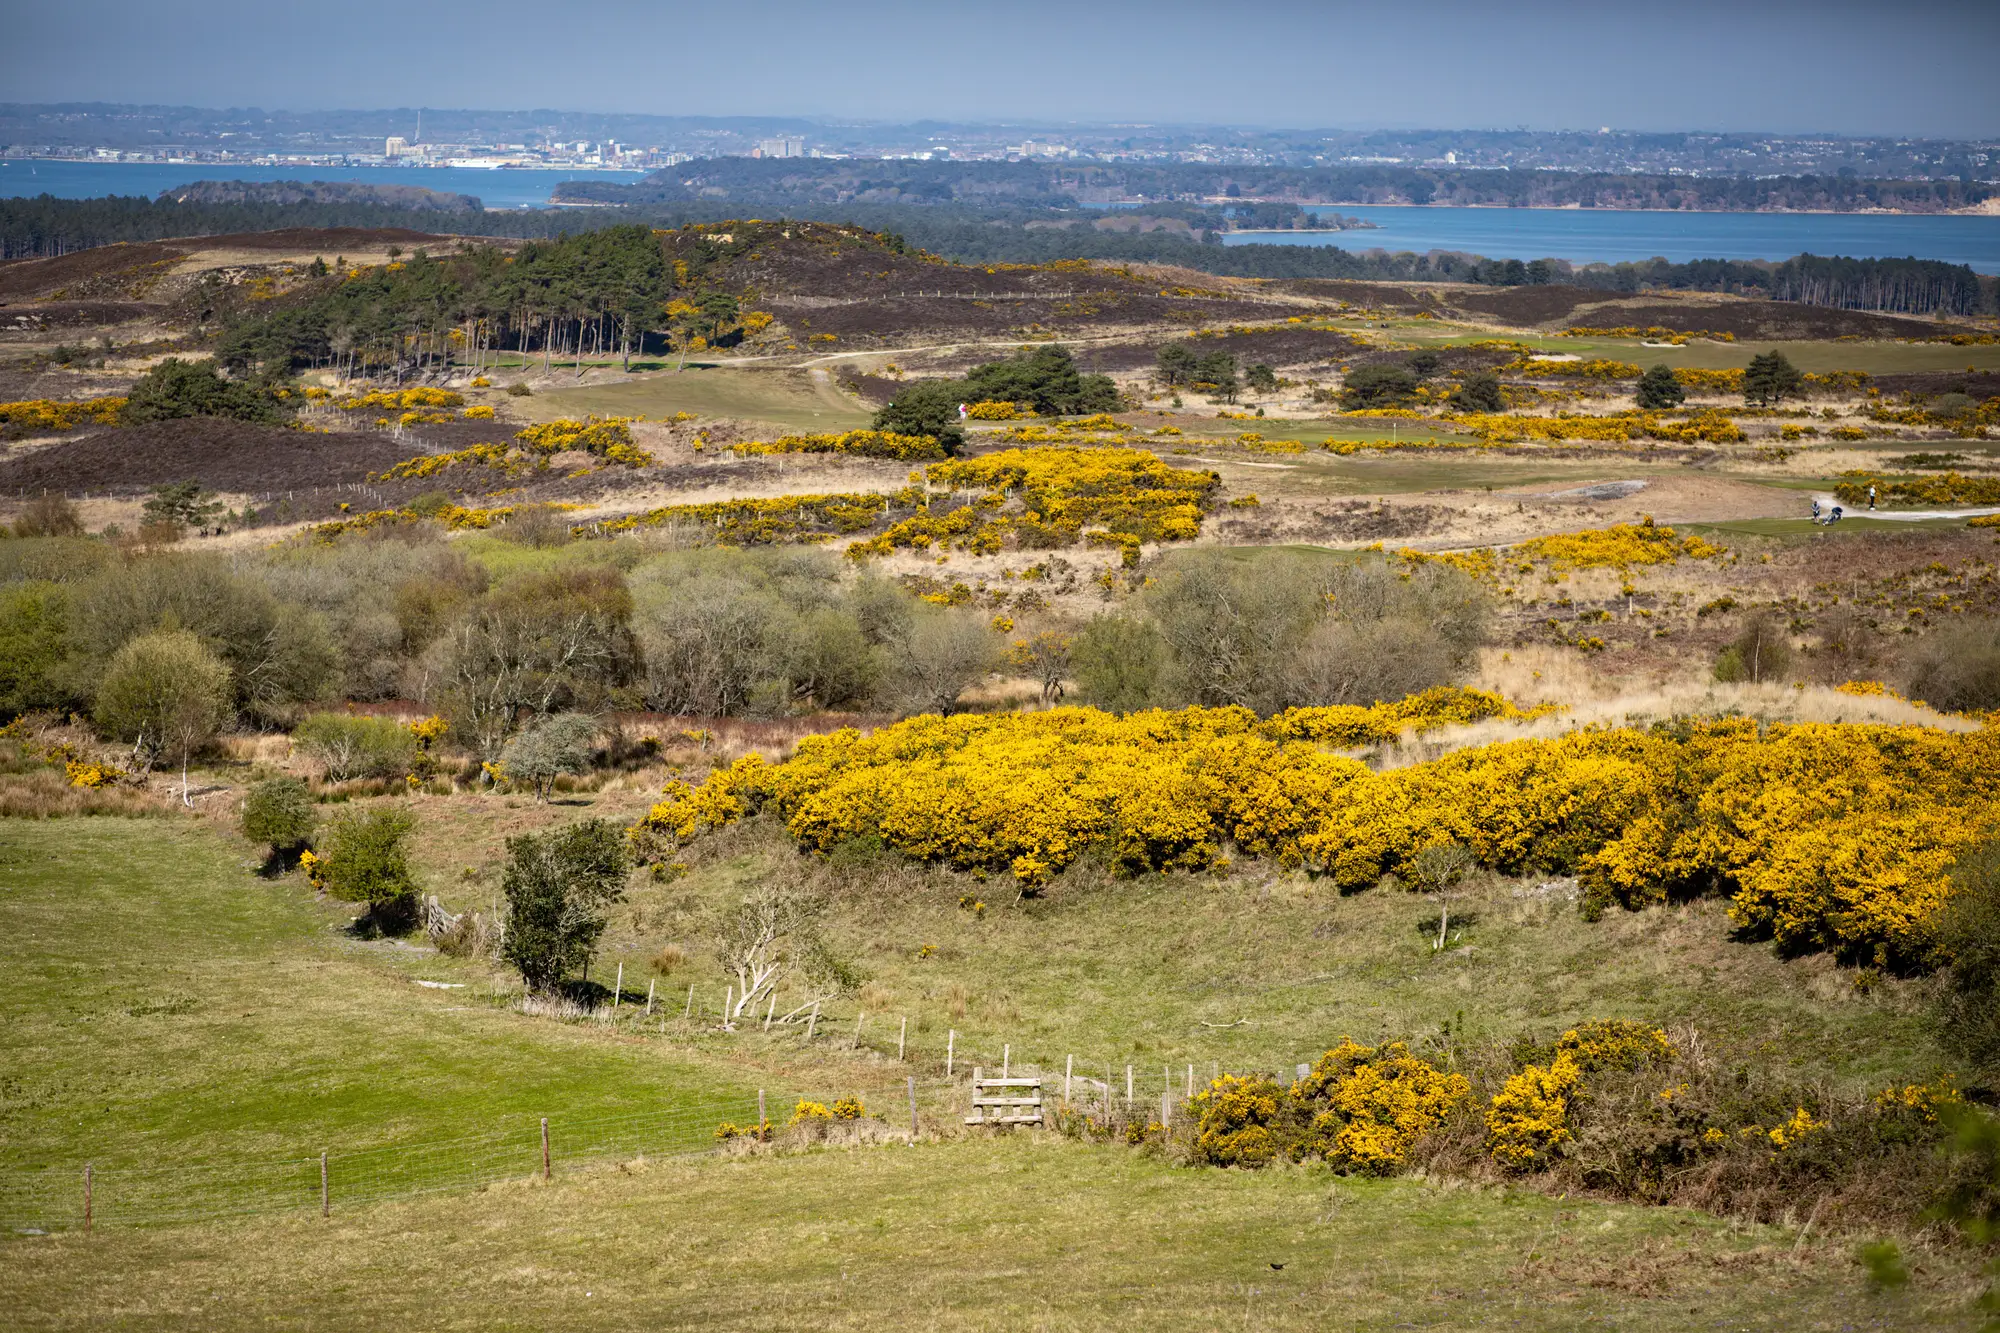
A seasonal map does not replace the crews. It tells you where to send them first, and which parts of the area to look at again.
What you get
The map is made once per season, from imagery timed to the window when your species separates from its neighbours. A pilot covers a part of your management area first.
Seasonal infestation map
Shapefile or GeoPackage
Mapped extent of the species you named across the pilot area, as polygons, dated to the pass the imagery came from. It opens in the GIS your treatment units already sit in.
Patch layer for crew routing
Shapefile or GeoPackage
The same map cut into patches sized for a crew, so a treatment unit can be briefed with what is in it. Join it to your units and you can see which parcels carry patches and which carry none.
Season-over-season comparison
Map and table
Once a second season has been mapped, a change layer shows where mapped extent grew, shrank or appeared. That is the line for the programme report: where the species was, where it is now.
How it works
Name the species and the area
Tell us the target species and send the management area boundary. Say when the species flowers or is most visible in your area, from your own crews' records.
Imagery is timed to the window
Very high resolution hyperspectral imagery is planned for that flowering or phenology window, when the species differs most from the native cover around it.
Classification
The spectral signature of the target is matched against the surrounding vegetation, and patches are mapped where it fits.
Hand-over
You get the infestation map and the patch layer. Send a crew to a handful of flagged patches first. What they find goes back into the next pass.
Limits
- L1
Not every species separates
A species shows up only if its flowering colour or growth stage differs enough from the native cover at the time of the pass. Some do not. We say which before you commit to a pilot.
- L2
A signature match, not an identification
The map flags where the spectral signature fits your species. It is not a botanical identification. Ground checks on flagged patches are still how you confirm.
- L3
Cloud can move the pass
The pass has to land in a clear window inside the flowering or phenology period. Cloud can push it later than you would like, or out of the window altogether.
- L4
Resolution sets a floor
Imagery at 0.5 m or finer resolves a patch of a few square metres. A single plant or a scattering of seedlings will not show, and neither will anything under a tree canopy.
- L5
Seasonal, not continuous
You get a map per season, timed to the species. It is not a live feed and it will not tell you what changed last week.
Who it's for
- Land managers and programme coordinators at regional agencies who run a control programme for a named invasive species.
- Teams who plan treatment units each season and want to know where the patches are before the crews go out.
- Programmes that need a season-over-season record of mapped extent for their report.
Who it's not for
- Teams that need the species confirmed with certainty. That takes a person on the ground.
- Species that only differ from the native cover in ways no flowering colour or growth stage shows.
- Continuous watching of a boundary.
- Automated decisions about where to treat. A person with the local knowledge still makes that call.
Questions from land managers
Can it map any invasive species?
No. It works for species with a flowering colour or growth stage that stands out from native vegetation at the time of the pass. Tell us your species and your area and we will say whether it is a fit.
Does it confirm the species?
No. It matches a spectral signature. Send a crew to check flagged patches, and use what they find to judge how far to trust the rest of the map.
What resolution is the imagery?
Very high resolution, 0.5 m per pixel or finer. That is enough to resolve patches, not single plants.
How often is the map updated?
Once a season, timed to your species' window. A second season gives you the comparison layer.
What if it is cloudy in the window?
The pass needs a clear window inside the flowering or phenology period. If cloud takes it, the pass moves, and the map may be later or, in a bad season, missing.
How do we check it against our own records?
Lay the patch layer over your treatment log and your crews' GPS points. Where the two disagree, send a crew and see who is right. That is the check we suggest for the pilot.
Will it work with our GIS and treatment units?
The layers are standard GIS files and open in QGIS or ArcGIS. Bring your treatment unit boundaries and they can be joined to the patch layer.
Who owns the imagery and the maps?
Use and ownership terms for the delivered layers are set in the contract before the pilot starts.
How is a pilot priced?
Each pilot is scoped on its own, from the size of the area, the species and the timing. You get a written scope to take through your procurement.
07 / Pilot
Tell us the species and the area, and we will say whether it separates.
Or .